In statistics, dispersion is the degree to which a distribution is stretched or squeezed. Measures of Dispersion differs with location or central tendency, and together they are one of the most used properties of distributions.
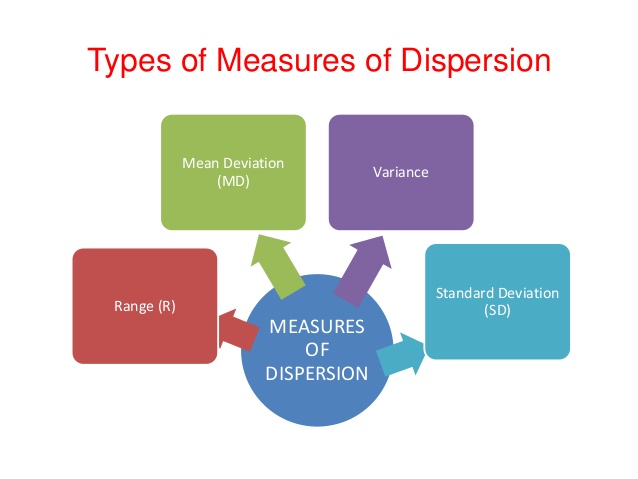
Most common measures of statistical dispersion are:
1. Mean deviation
2. Variance
3. Standard deviation
4. Range & Inter-quartile range.
Let us discuss the measures of dispersion and there examples
Index
Mean Deviation
Mean Deviation is a statistical measure to find the average deviation of values from the mean in a sample.
How to calculate Mean Deviation?
1. Calculate the average of the observations
2. Calculate the difference of each observation from the mean (deviations of all the observations).
3. Average all the deviations.
Mean Deviation Example
If we take nos. 1 to 7 and find their mean deviation then,
The mean of these terms will be 4
And their deviation from the mean will be
| Value | Deviation from the mean (4) |
| 1 | 3 |
| 2 | 2 |
| 3 | 1 |
| 4 | 0 |
| 5 | 1 |
| 6 | 2 |
| 7 | 3 |
And mean deviation comes out to be 1.714
Variance
The Variance is a degree of variability. It is determined by taking the average of squared deviations from the mean. Variance represents the degree of spread in your data set. The further spread the data, the larger the variance to the mean.
Formula
\(\sigma^2 = \frac{1}{n} \sum^n_{i=1}(x_i – \bar{x})^2\)Variance Example
Sample A: -2, 2, 2, -2, -2, 2, -2, 2
Sample B: -1, 1, 2, -2, 2, -1, 1, -2
The mean for both these samples is a ‘0’.
But variance for sample A is ‘4’
And that for sample B is ‘5’.
We can see that Sample B had a more widespread set of data, with the mean same as Sample A.
Standard Deviation
The Standard Deviation is a measure of the amount of variation of a set of values. The standard deviation of a random variable is the square root of its variance.
A low standard deviation shows that the values tend to be approaching the mean of the set, while a high standard deviation indicates that the values are spread out across a wider range.
Formula
\(\sigma = \sqrt{\frac{1}{n}\sum^n_{i=1}(x_i – \bar{x})^2}\),
Here,
\(n\) = no. of terms
\(x_i\) = mean
\(\bar{x}\) = elements of data
Standard Deviation Example
Sample A: -2, 2, 2, -2, -2, 2, -2, 2
Sample B: -1, 1, 2, -2, 2, -1, 1, -2
The mean for both these samples is a ‘0’.
Here Standard deviation will be
Sample A: \(2\)
Sample B: \(\sqrt{5}\)
Range
The range is the difference between the highest and lowest values of a dataset.
Range Example
For the dataset {4, 6, 9, 3, 7}
The lowest value -> 3
The highest value -> 9
So, range -> 9-3=6.
Interquartile Range
The Interquartile Range(IQR), also called the mid-spread, is a measure of statistical dispersion, being equal to the difference between 75th and 25th percentiles, or between upper and lower quartiles, IQR = Q3 − Q1.
In other words, the IQR is the first quartile subtracted from the third quartile. These quartiles can be seen on a box plot on the data.
It is a trimmed estimator, defined as the 25% trimmed range, and is a commonly used robust measure of scale.
Applications of Measures of Dispersion
- A measure of spread also called a measure of dispersion, is used to describe the variability in a sample or population.
- Measures of Dispersion are used to estimate “normal” values of a dataset, measures of dispersion are important for describing the spread of the data, or its variation around a central value.
- It is usually used in conjunction with a measure of central tendencies, such as the mean or median, to provide an overall description of a set of data.
FAQs
The measure of dispersion shows the spread of data. It explains the data differs from one another, delivering a precise picture of the distribution of data. Dispersion is the degree to which values in a distribution differ from the average of the distribution.
Measures of dispersion describe the spread of the data. They include the mean deviation, range,interquartile range, standard deviation, and variance.
Measures of central tendency are used to calculate “normal” values of a dataset, measures of dispersion are crucial in explaining the range of the data, or its variation around a mean value.
Standard deviation is studied as the most reliable measure of dispersion. It is based on all values of given data and thus presents data about the entire series, a change in one value affects the value of the standard deviation and hence is the most widely trusted and used.